8 KPIs to follow to analyze your website

6 minutes
.
April 24, 2025


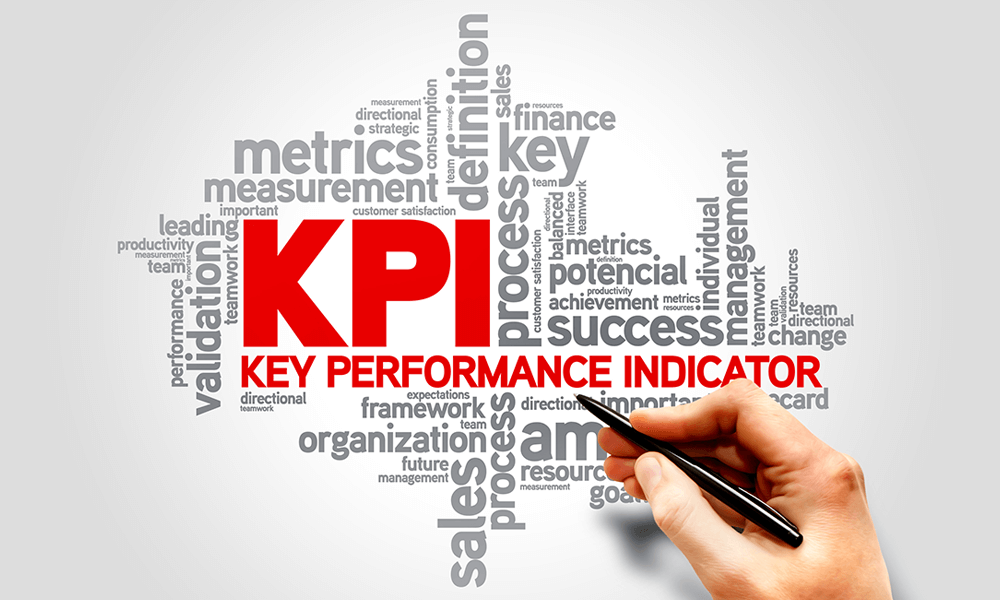
A KPI (Key Performance Indicator) is an indicator that makes it possible to measure and evaluate the effectiveness of a website. These indicators are essential to know whether your website is achieving its goals, whether it is an increase in traffic, an improvement in the conversion rate, or visitor loyalty. Tracking the most important KPIs allows you to better analyze your website and optimize its performance over the long term. It also helps you build more targeted digital marketing strategies.
For optimal optimization and rigorous monitoring of your KPIs, you can call on our web agency Noqode, specialized in the creation of efficient websites.
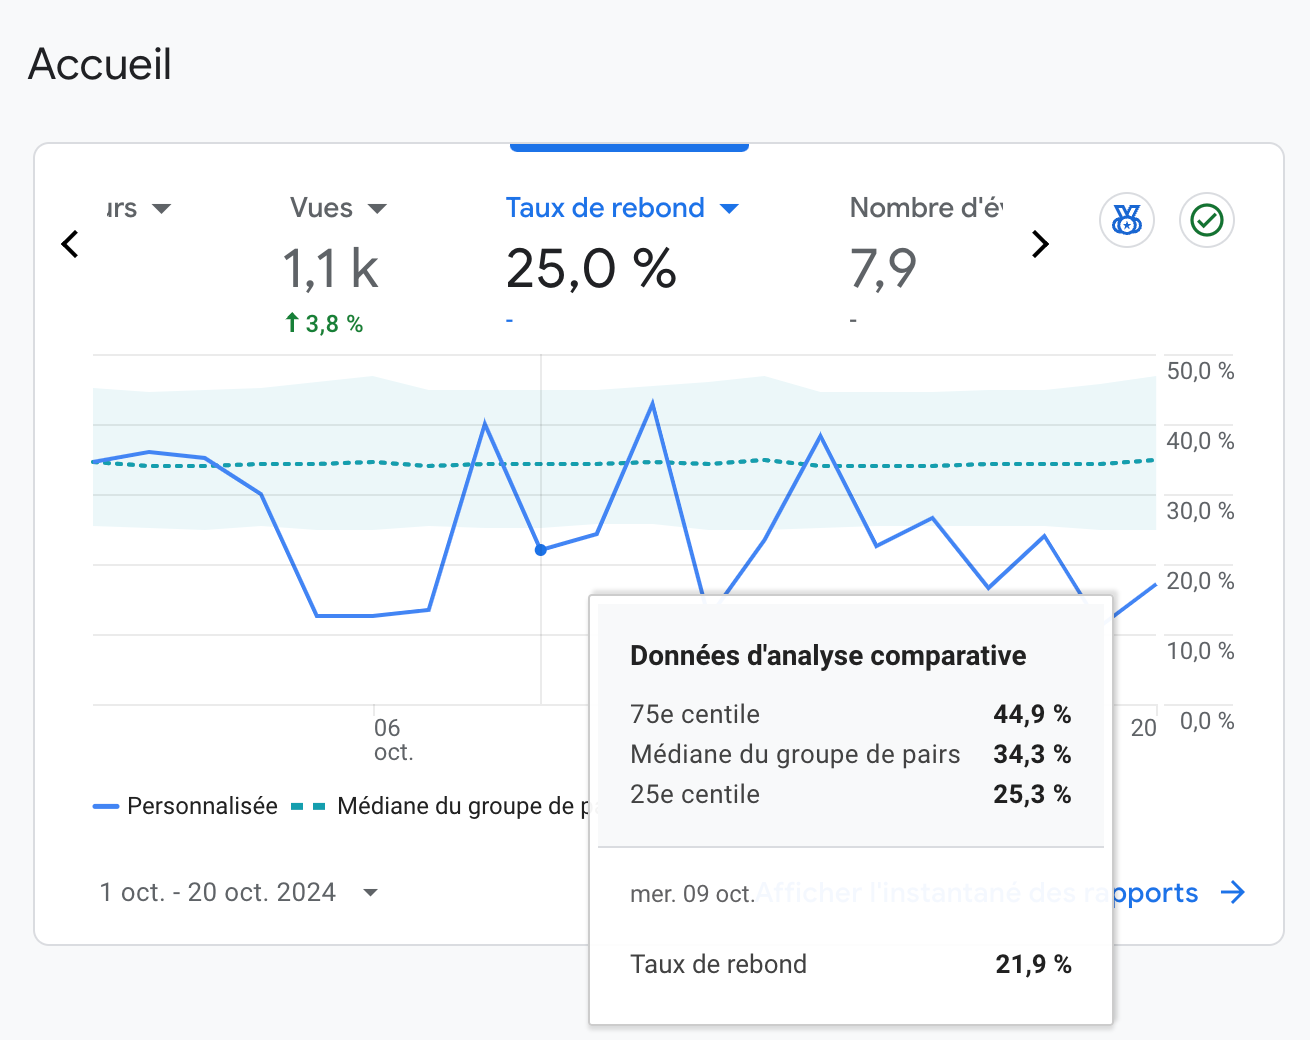
The bounce rate measures the percentage of visitors who leave the site after viewing a single page without engaging further. A high bounce rate may indicate that the content on your site is not engaging enough or that the user experience needs to be improved. A smooth user experience is a key element in the success of your website.
👉 Advice: Use design tools like Figma to optimize the user interface and make navigation more pleasant. Smooth navigation encourages visitors to explore more pages, increasing the time spent on the site.
The conversion rate is another key KPI that tells you whether visitors to your site take a specific action, such as a purchase on an e-commerce site or a newsletter subscription. It is essential to assess the overall performance of your digital marketing strategy and to find out whether your site is relevant and engaging.
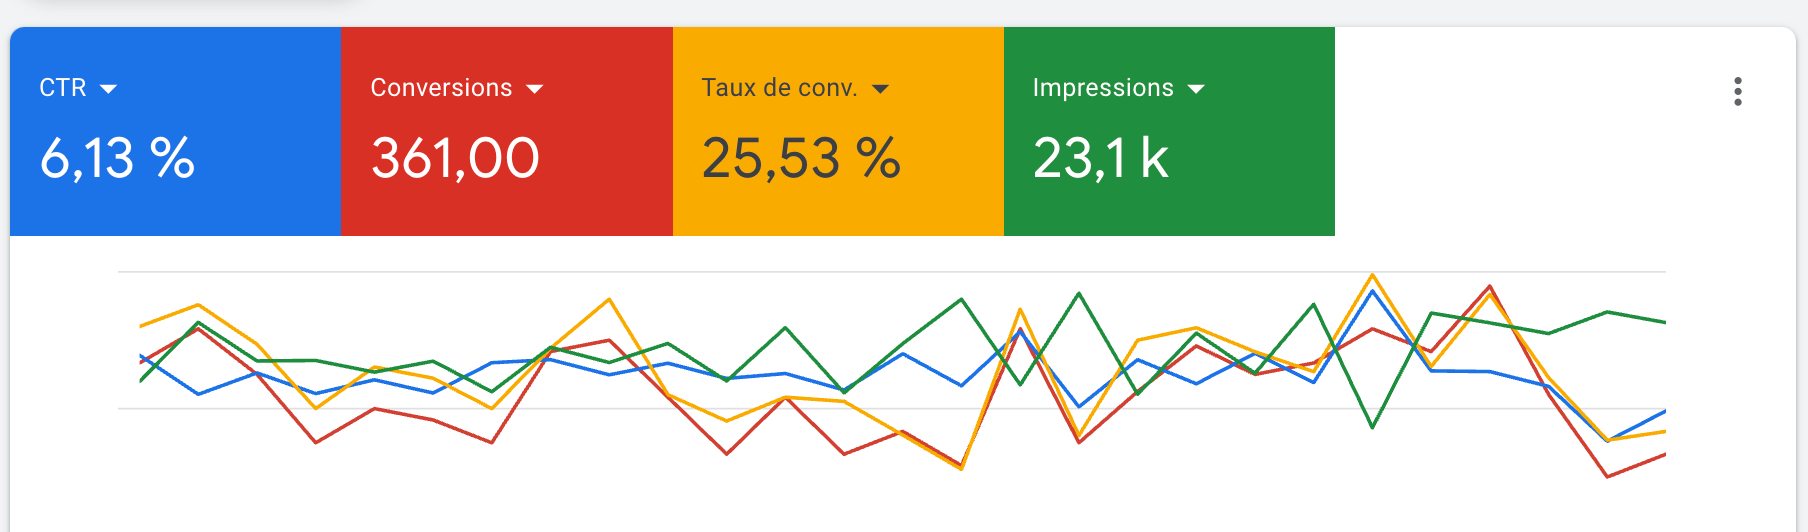
👉 Advice: An effective marketing strategy with campaigns on Google Adwords can increase your conversions. You can also analyze these conversions with SEMrush to refine your efforts and maximize the effectiveness of your site.
Knowing where visitors come from is essential to optimize your digital marketing strategy. By analyzing performance indicators, you can better understand user behavior and traffic sources. You can then focus your efforts on the most effective channels, whether it's organic search, advertising campaigns, or social networks.
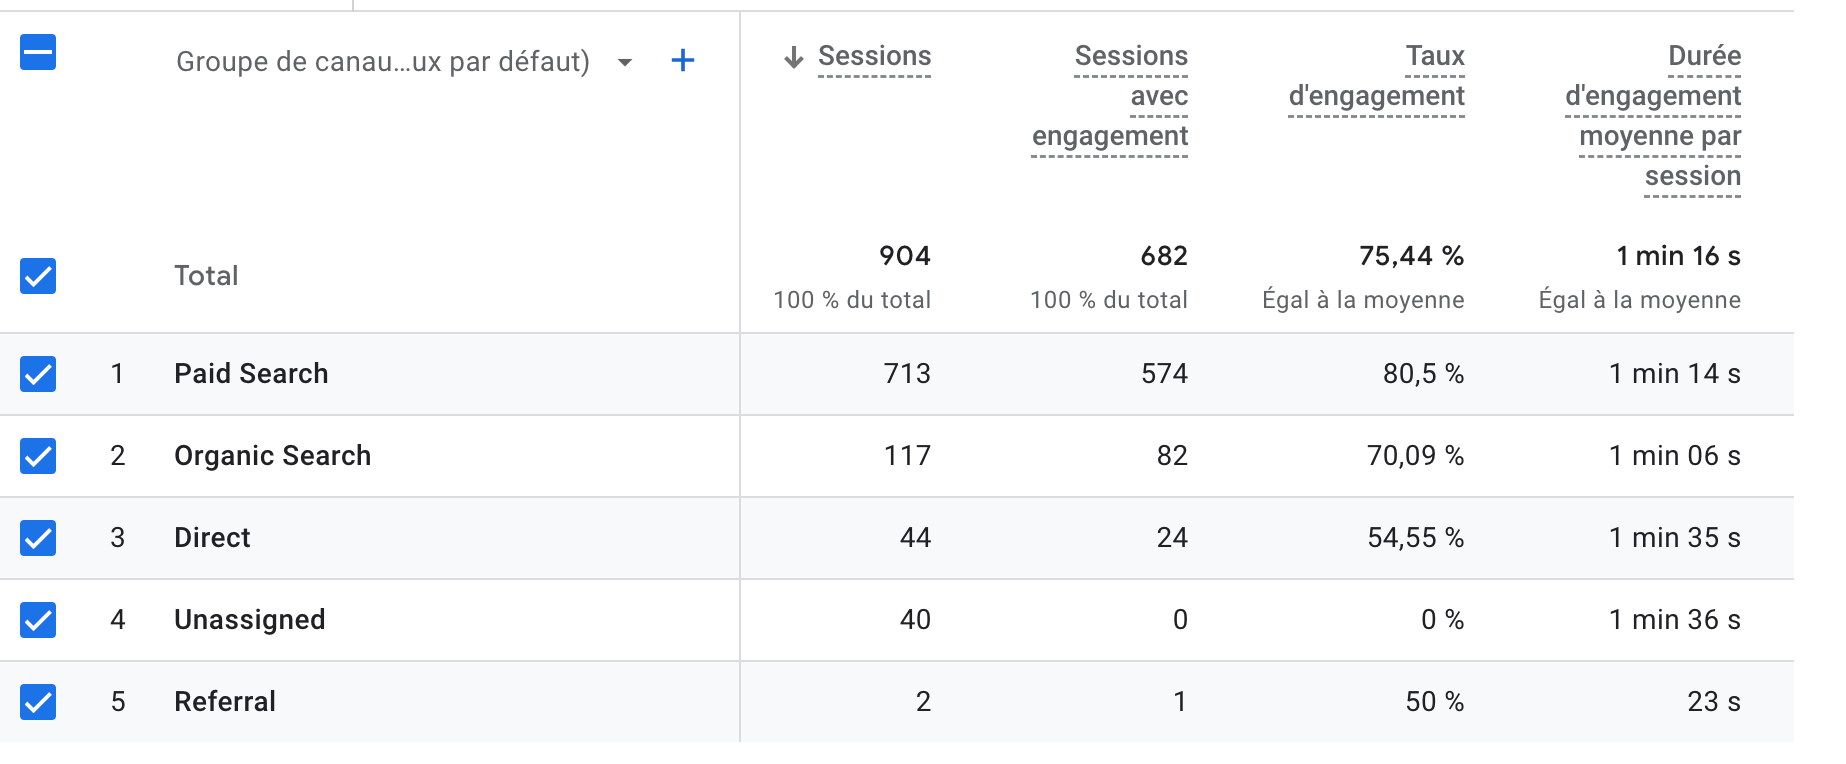
👉 Advice: By identifying traffic sources, you can effectively allocate your marketing budget to the channels that generate the most results.
The average time spent on a page is a great indicator of how interested your visitors are in your content. A long time shows that your site is holding users' attention, but it is important to analyze the indicators to identify areas for improvement in your website, to find out whether it is engaging and whether users like what they see.
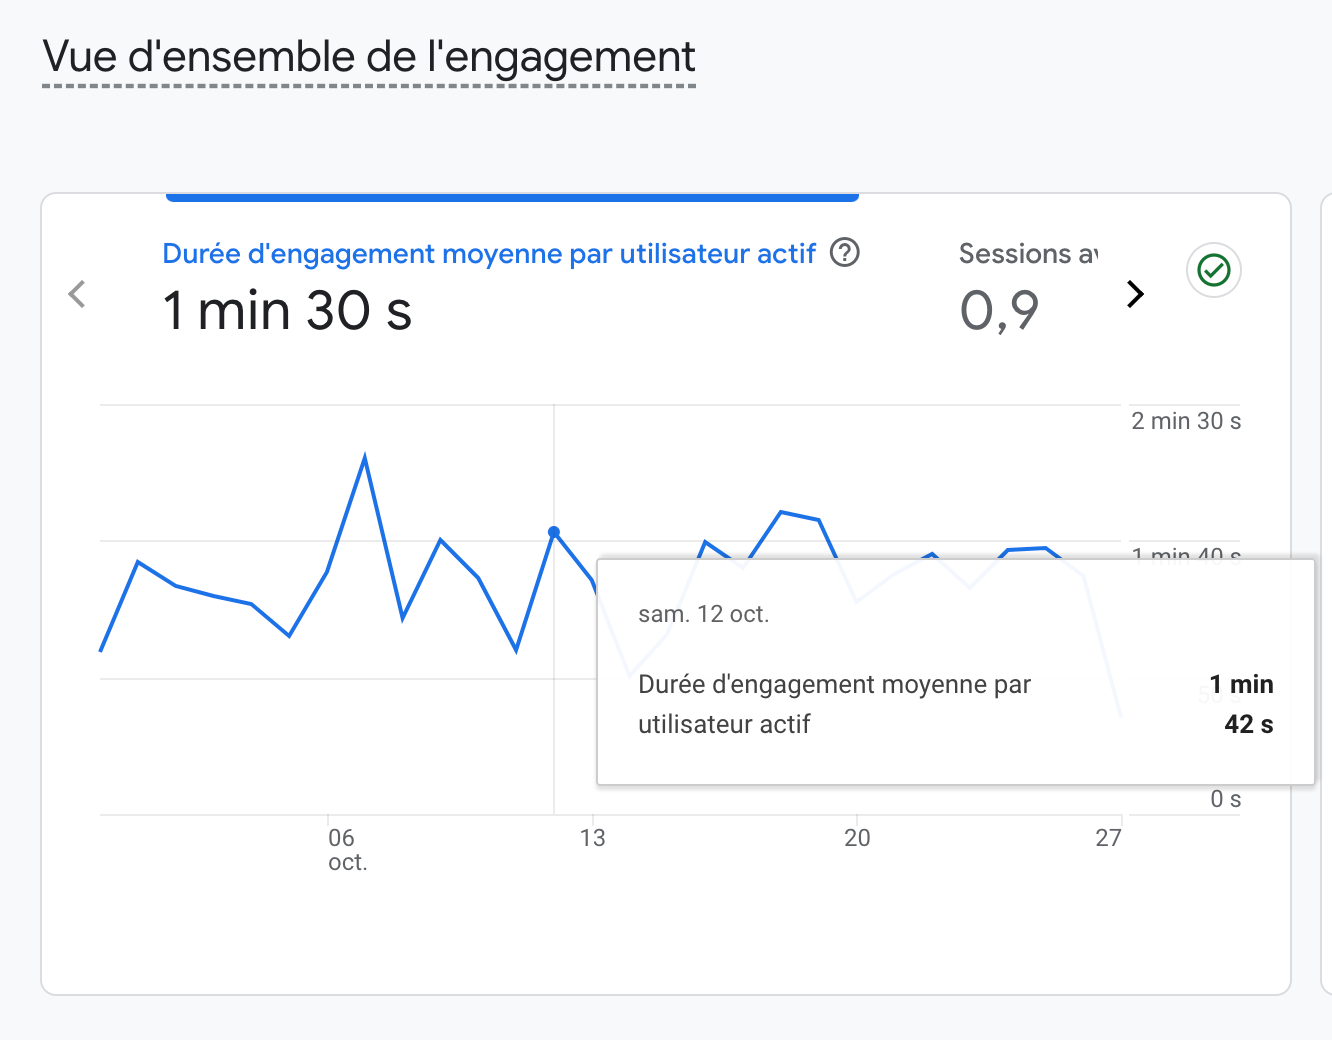
👉 Advice: Improve content structuring with tools like WordPress or Webflow. Well-structured content promotes better user retention and encourages further exploration of the site.
For better monitoring of your performance, it is crucial to measure the main KPIs of an e-commerce site. The cart abandonment rate is a critical KPI. It measures the percentage of users who add products to their shopping cart but leave your site without completing the purchase.
👉 Advice: Simplify the shopping journey and offer solutions such as promotions or free delivery to encourage the completion of purchases.
The loading time has a direct impact on the user experience. A slow site can discourage visitors and increase the bounce rate, which affects the overall performance of your site. In addition, Google favors fast sites in its search rankings, making optimal loading speed essential for good SEO.
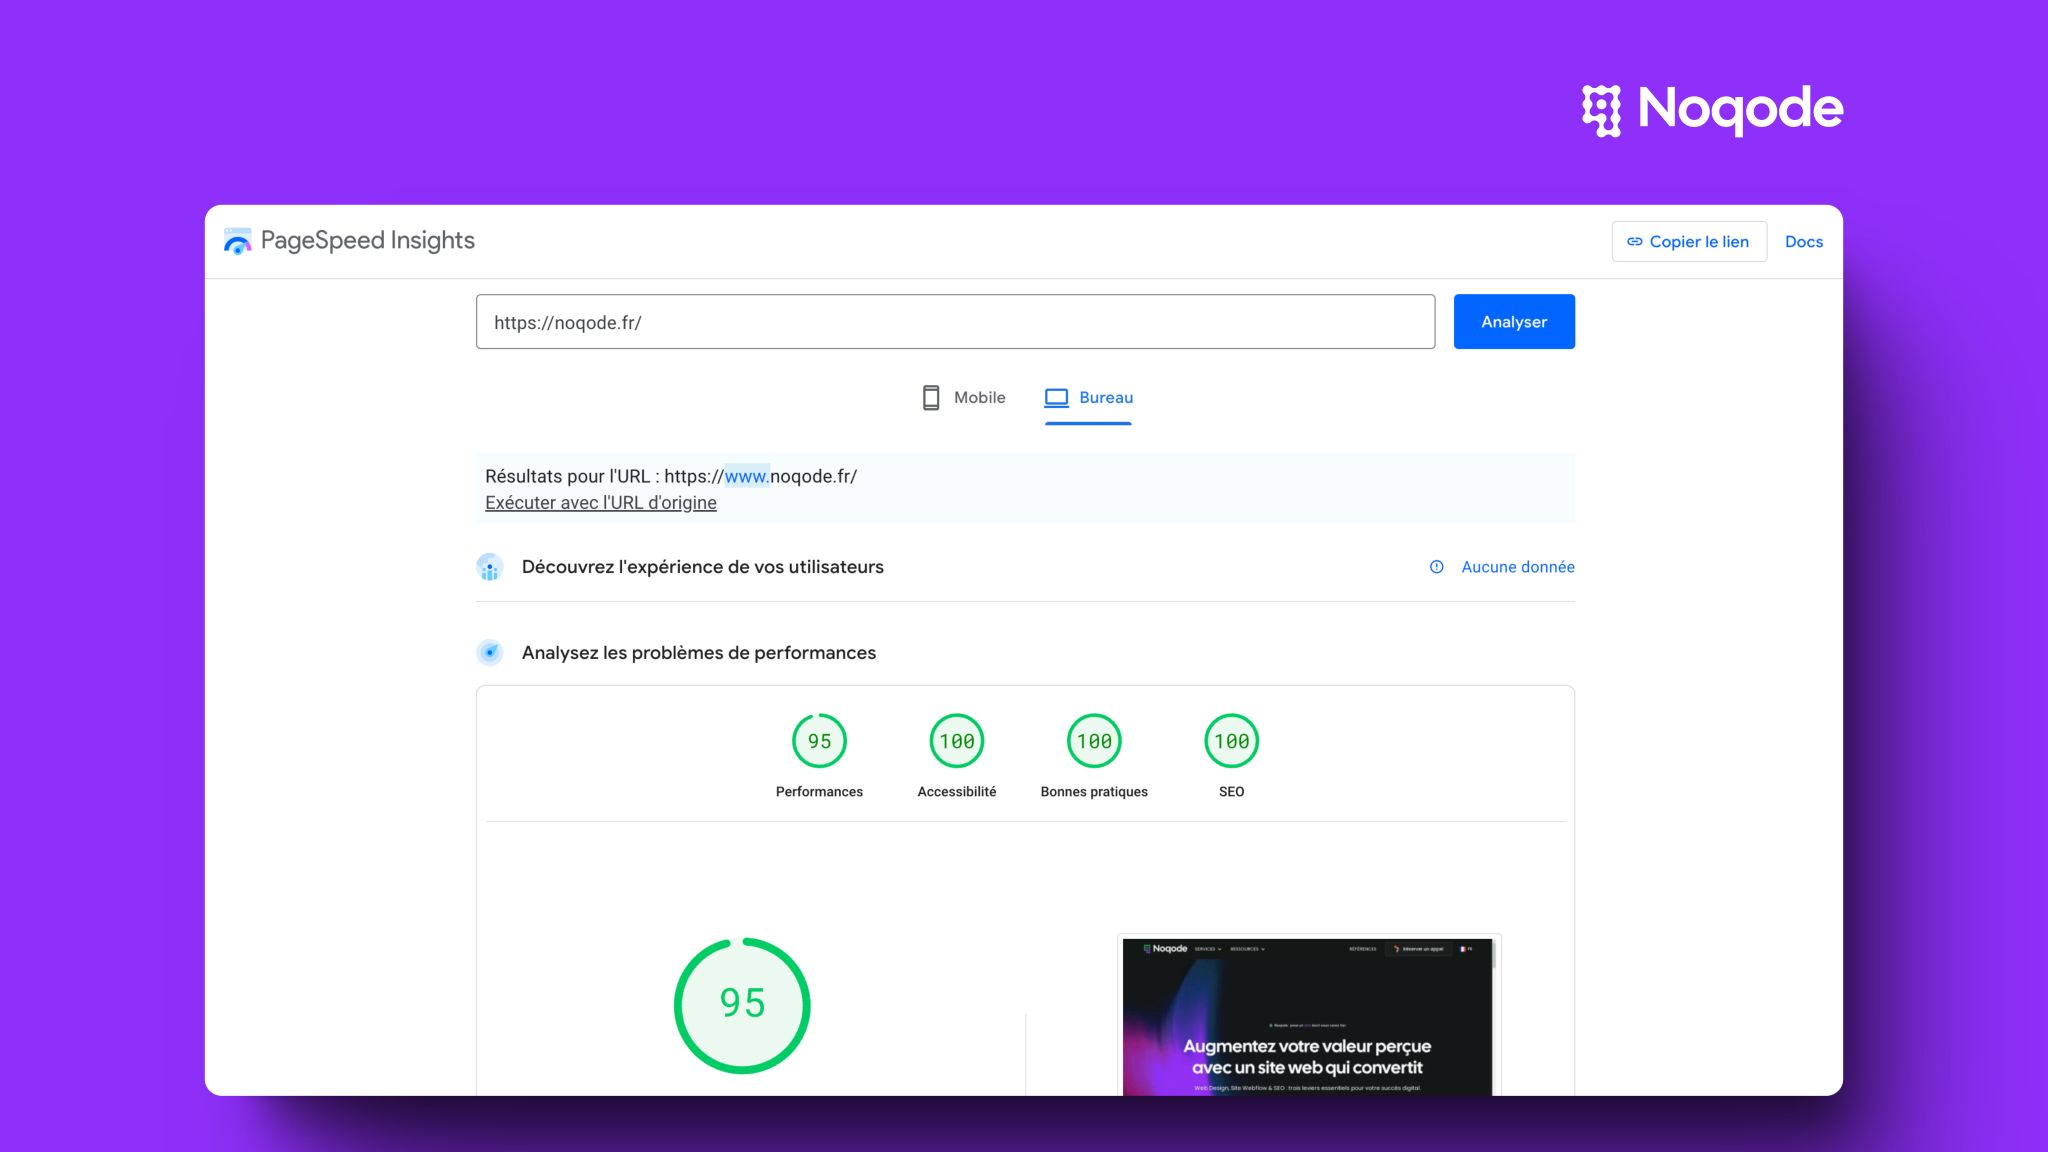
👉 Advice: If you are looking for an effective solution, Webflow is a platform that is particularly optimized for creating fast and efficient sites. To maximize the performance of your site, you can call on a specialized Webflow agency that builds efficient, tailor-made websites and knows how to implement best practices for an ultra-fast site.
The retention rate measures the percentage of visitors who return to your site after a first visit. The higher the rate, the more it indicates that your content is relevant and engaging. Returning visitors are often more likely to become repeat customers.
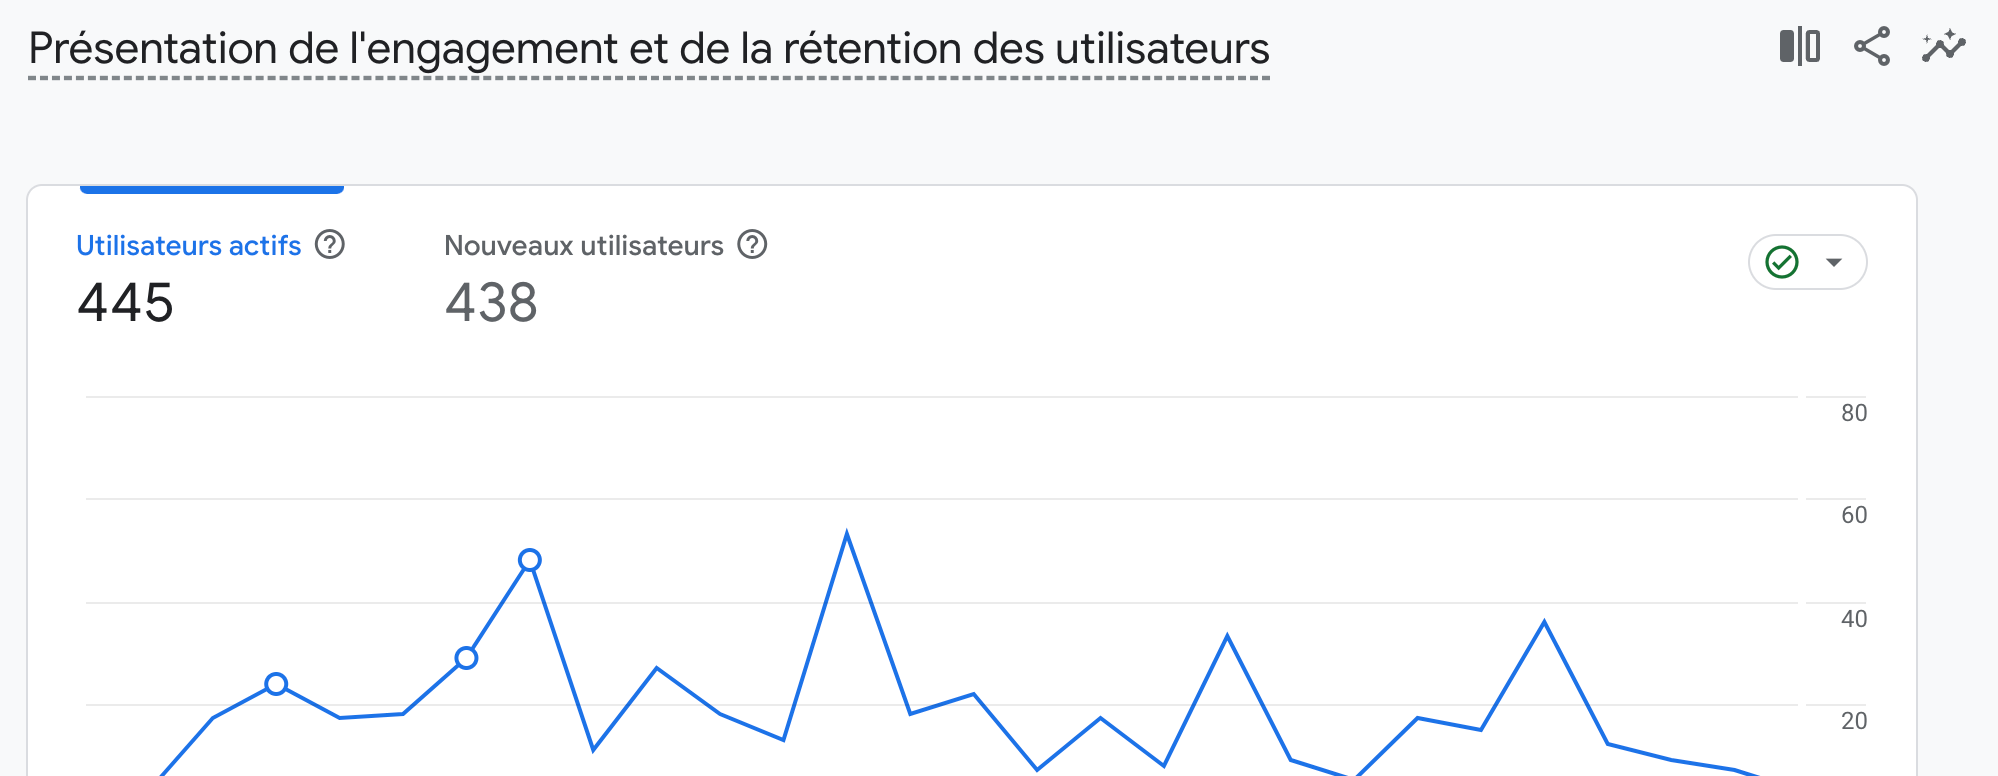
👉 Advice: Create quality and engaging content like blogs, tutorials, or webinars to attract and retain your audience.
By watching the most visited pages, you can understand what grabs your users' attention and optimize your content accordingly. You can also use this information to adapt your marketing campaigns and improve the performance of your website.
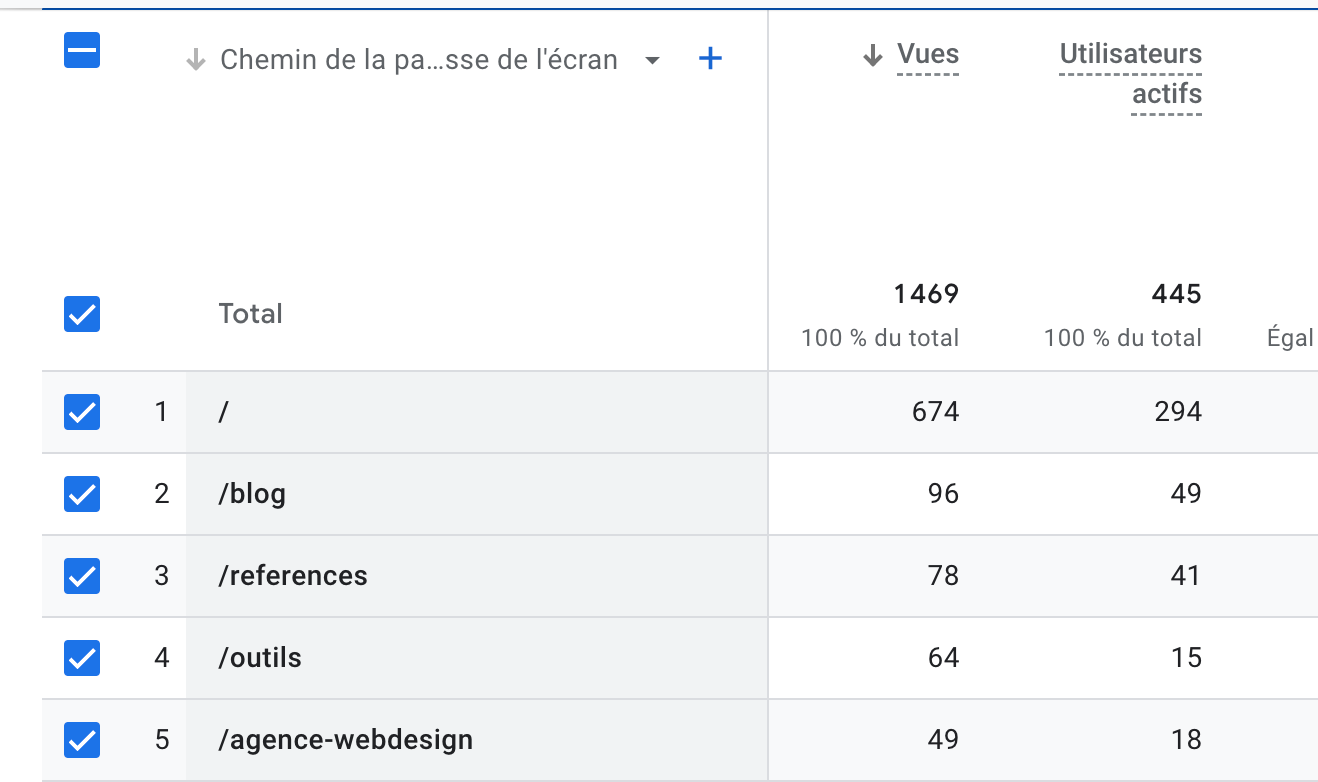
👉 Advice: Highlight popular pages in your newsletters or on your social networks to maximize their visibility and the traffic to your site.
Tools like Google Analytics are essential for effectively measuring the KPIs of your website. These tools make it possible to track specific metrics such as the conversion rate, the loading time, or the traffic sources. By combining this data with your overall marketing strategy, you can refine your decisions and improve the efficiency of your website.
Regularly analyzing the KPIs to follow for your site is essential to maintain optimal performance. By identifying areas for improvement, you can optimize your website and guarantee a better user experience. For regular monitoring, it is advisable to set up a personalized dashboard that groups together the key KPIs according to your goals.

👉 Advice: If you need help setting up and interpreting data, you can call on a web agency such as noqode.fr, which will support you throughout this process with tailor-made solutions to optimize your performance.
The KPIs to follow include the bounce rate, the conversion rate, the traffic sources and the loading time. These indicators make it possible to better understand the behavior of users and to optimize the performance of the site.
The conversion rate measures how effectively your site turns visitors into customers and grows the average basket. A high rate reflects a well-optimized user journey.
Google Analytics is one of the most popular tools to analyze traffic and measure KPIs. It provides detailed data on visitor behavior.
A high bounce rate may indicate that visitors are not finding what they are looking for on your site. By optimizing content and user experience, you can reduce this rate.
To improve the loading time, it is recommended to optimize images, reduce unnecessary code and use a powerful platform like Webflow.
KPIs should be analyzed regularly, ideally every month, to adjust your digital marketing strategies based on performance.